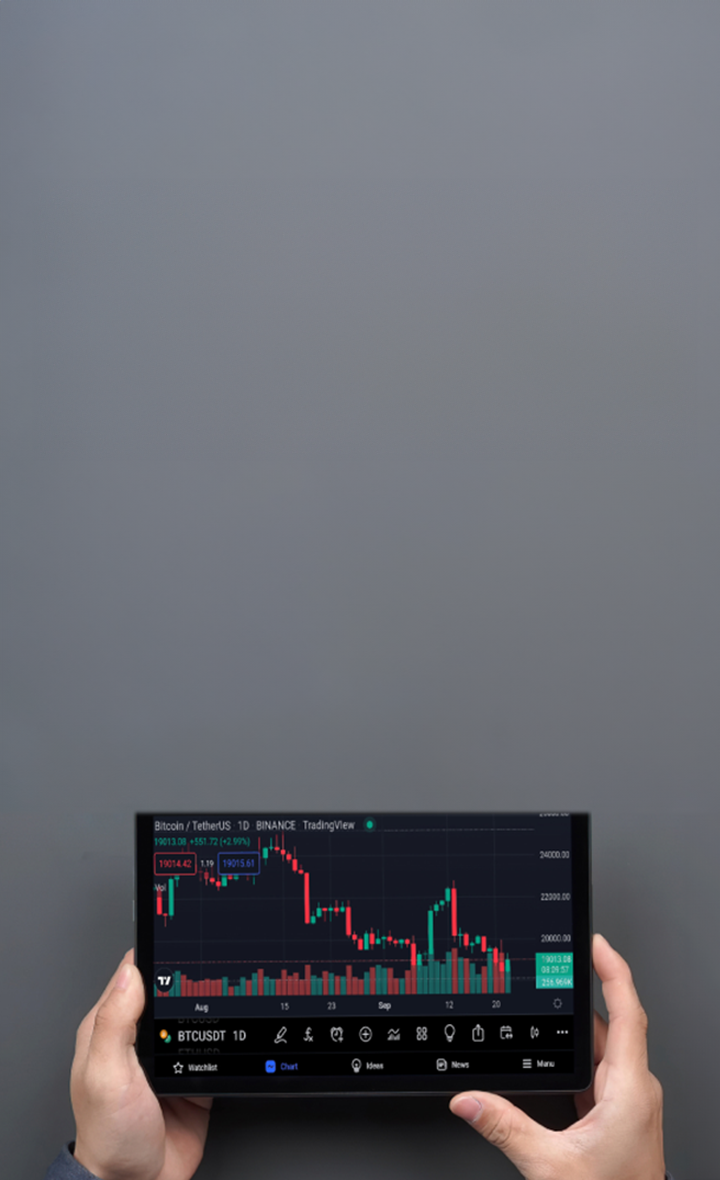
What is Oil Trading? Understanding the Oil Market
The popularity of oil trading is, in part, due to the global reliance on oil as a commodity. From fuel for vehicles and buildings to powering the energy industry, commercial transportation, and manufacturing, oil is integral to many parts of our lives.
The significance of oil makes it a valuable commodity. When a commodity is deemed valuable, it becomes a desirable trading instrument. That’s why popular oil trading exchanges, such as the New York Mercantile Exchange (NYMEX), are hives of activity.
- Supply and demand: if supply is low and demand is high, the price of oil increases. If there are plenty of barrels of oil in supply and demand is low, the price of crude oil decreases.
- Geopolitical events: decisions made by world leaders, particularly from those in the G10 or OPEC Countries, can influence the price of oil. For example, if war breaks out in an OPEC country, oil production can be disrupted. This could decrease supply and drive up prices.
- Economics: the financial state of countries can impact the price of oil. If a country has to reduce imports because its currency is weak and GDP is falling, that can decrease the demand for oil. That could cause the price of oil to drop.
Exploring Ways to Trade Oil
This means you’re speculating on the price movements of oil in various ways rather than owning the underlying asset (i.e. owning barrels of oil). Some of the common securities used for oil trading are as follows:
CFD Oil Trading
|
Futures Oil Trading
|
Oil ETFs | |
Objective | Taking out oil Contracts For Difference (CFD) on the price of crude oil stocks | Buy or sell a specified number of barrels of oil (lots) for a pre-agreed price on a set date | Invest in a basket (collection) of financial securities grouped as a single entity/price |
Can you go long and short? | Yes, you can go long if you believe the price of oil will rise, or short if you believe it will fall | Yes, futures contracts allow long or short positions based on the price outlook | No, ETFs do not typically offer the flexibility to short directly, but separate inverse ETFs may be available |
How to Trade | Trade Oil CFDs by speculating on price movements without owning physical oil. Go long if you believe the price of crude oil stock will increase. You go short if you believe the price of crude oil stock will decrease | Enter a futures contract to buy or sell oil at a predetermined price in the future, locking in that price regardless of market fluctuations | The value of an ETF fluctuates based on the performance of its constituent assets i.e. if the companies are performing well, the ETF’s value increases |
Can you trade negative prices? | Yes | Yes | No |
Do trades expire? | No | Yes | No |
Minimum Capital Required | Relatively small, minimum deposit of $100 | Generally higher due to the need to cover margin requirements; often requires thousands of dollars | Typically low; you can buy shares of ETFs with the amount required to purchase the ETF’s share price |
Leverage | Up to 1:200 | Moderate to high leverage depending on the contract and broker, though usually less than CFDs (e.g., 1:10 to 1:50) | No leverage directly in ETFs |
Key Considerations Before You Start Trading Oil
The most important things you should do in the oil trading market are:
1. Have a plan that includes financial goals, loss limits, and strategies for different types of oil trading. For example, you might have a different strategy for CFD oil trading compared to oil-focused ETFs.
2. Timing matters when you’re trading oil. Ideally, you want the markets to be active because prices are more likely to move, which means you’ve got more chances to capitalise on long/short trades. Some of the best times to trade oil online are between 20:00 (UTC+8) and 13:30 (UTC+8) when the New York Mercantile Exchange (NYMEX) is open.
3. Learn to manage your money. You should never risk more than you can afford to lose. More specifically, traders should take into account the inherent risks of trading oil. Check out the next section for more on money management and its relationship with lot sizes.
Fundamental Oil Trading Strategies for Beginners
Based on this, you need to know how to calculate lot sizes when you’re using an online oil trading platform.
How to Calculate Lot Size in Oil Trading
For example, a 0.1 lot is equal to 0.1 (i.e. 10%) of a standard lot. So, in real terms, a 0.1 lot is equal to 100 barrels of oil. Once you’ve chosen your lot size, you need to consider how many lots you want and the current price of crude oil.
EXAMPLE
- Let’s say the price of oil is $50.
- You want to trade 1 fractional lot.
- The lot is 0.01, which means it’s equal to 0.01 (i.e. 1%) of a standard lot. In real terms, 1 lot equals 10 barrels of oil.
Based on these factors, the cost of opening a trade would be:
- 50 x 10 = $500
This cost is what you’d pay to open a trade without leverage. There are upsides and downsides to trading oil with leverage. The upside is that you only need to commit a percentage of the cost, technically known as the margin.
For example, 1:50 leverage means you’d need to put 1/50 = 0.02 (i.e. 2%) of the trade’s cost. So, in our scenario, trading oil with 1:50 leverage means it would cost $10 to enter the trade (2% of $500 = $10).
What these examples are designed to show is that lot size, price of oil, and leverage determine how much you need to open oil trades. You can’t control the price of crude oil, but you can manipulate lot size, how many lots you buy, and leverage. So, if you want to improve your chances of success, make sure you consider these variables.
In addition to the concept of money management in online oil trading, here are three more things to consider:
Long vs. Short Oil Trades
Technical Indicators for Oil Trading
Some of the most popular technical indicators experts use when they’re trading in crude oil are:
- Moving Averages (MA) – an indicator that looks at the average price over a specified period.
- Moving Average Convergence Divergence (MACD) – this technical indicator subtracts the 26-day Exponential Moving Average (EMA) from the 12-day EMA to give you a MACD line. The 9-day EMA of the MACD is the signal line. If the signal line is positive, the market is bullish. If it’s negative, the market is bearish.
- Relative Strength Index (RSI) – this indicator looks at price momentum over time to determine if the commodity (e.g. oil) is overbought or oversold. An overbought commodity means the price could be set to decrease because it’s overvalued and vice versa.
Chart Patterns Used in Crude Oil Trading
Bullish Engulfing
A two-candle reversal pattern, where the second candle completely covers the first candle inside it.
Three Outside Up
Typically signals the end of a downtrend and a reversal. A bearish candle is followed by a bullish candle which completely covers the bearish one, followed by a third bullish candle, which projects the reversal. Essentially, the third candle acts to confirm the Bullish Engulfing pattern.
Inverted Hammer
Candlestick pattern that looks like an upside-down hammer, usually formed during downtrends and signals a reversal.
Doji Star
Doji, Japanese for “the same thing”, are candlesticks that have a similar open and close. Doji stars are a pattern where a doji forms above or below a trend, and can signal a reversal.
Harami Cross
A variant of the Harami pattern. Consists of a two-candle pattern within a trending market, where the second candle is a Doji which is completely enveloped within the first candlestick.
Discipline in Oil Trading
The practical part is easy when you use the best trading platform for crude oil. It’s easy because you can set stop-loss and take-profit limits. These orders automatically close trades based on predefined variables. That means your moves are being controlled by data rather than impulse.
Start Your Oil Trading Journey with Confidence Today
Then, when you’re a verified customer, make a small deposit and enter the live oil trading markets. Start with the smallest lot sizes possible. This will give you a chance to get comfortable without risking all of your money. From there, you can gradually scale up and explore everything the markets have to offer.